Sugar Fast Blog

Why do Americans eat a lot of junk food? Because it’s the easy way out.

Unhappy? Open a candy bar. You’ll feel happy again in seconds. Kid crying? Hand them a fun-sized candy bar. They will be quiet.  

If you are struggling with paying bills or health (I know, the health one is ironic here), then you’ll tend to reach for anything that is fast and easy to deal with immediate problems.

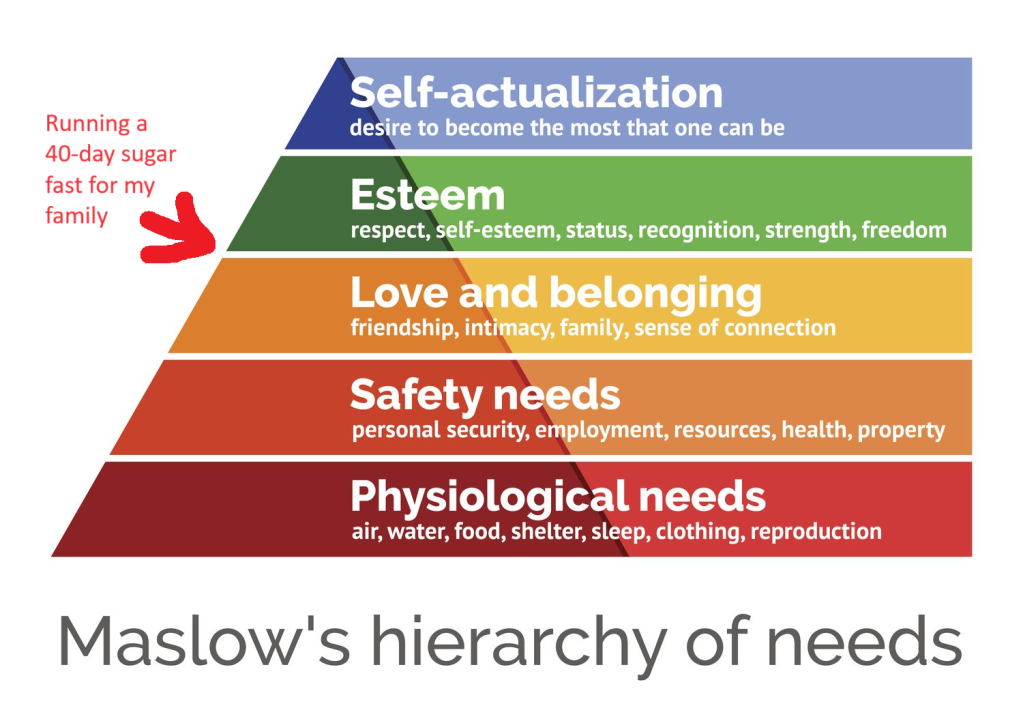
For me, I decided to wait until my semester is over, so I won’t be attempting this while teaching or traveling. A 40-day sugar fast for the whole family technically began on May 1, but the grocery shopping changed earlier. The idea was to eat down junk and not buy new for over a week.

Forty days isn’t much in the big scheme. The idea is to make a deposit on health. Possibly, I’ll break a mild sugar addiction to the point where the body doesn’t expect it so much. Maybe something that we end up doing to meet this artifactual goal will end up getting into the routine on a regular part of the year when there is more travel and work. Part of the problem I identify is that there are points throughout the day where people feel unhappy. If sugar is on hand, then there is a tendency to reach for it. Part of what I’m going to do is insert more healthy food and activities, but of course that is a lot more work. If it’s just not there, people barely miss it.

I’m already so much happier at home. There is barely any sugary junk food left in the house. Now if the kids circulate the kitchen, I don’t have to stress out and yell at them to not eat cookies before dinner or whatnot.

Internet: So, you’re going to meal plan and not eat dessert for a month? This was worth telling everyone?

Me: I’ve been thinking about it constantly since Christmas.

Internet: Wasn’t this the site where we get more optimistic about the world?

Me: There are some things I read about and decided against. I will not worry about sugar in sauces (e.g. Chicken teriyaki bowl). I will not cut out bread or pasta. There is a sliding scale of how healthy you can be and how much time you are willing to put in. I have decided on a level of effort and a fixed amount of time. I’m not even going to turn down cookies if they are offered to us for free. The most important thing is to stop buying junk from the grocery store. It’s financially very cheap, but actually very costly.

P.S. It’s a small step toward getting my personal chef, but I saw an ad for Walmart “emeals” which is more intelligent grocery delivery plus recipes. I haven’t tried it myself, but it seemed like an update on What the Superintelligence Can Do For Us. When I have the equivalent of “former restaurateur, Frances,” in my house, then I just won’t need anything else and innovation can stop there, thanks.

Social Cost Irregularities

If you want an economist to support a government intervention, then there are two major sets of logic that they generally find attractive.

The first concerns rate of return and attracts narrower support. If the government can invest in a project in a way that the private sector couldn’t/wouldn’t and the payoff is bigger than the investment by enough, then the project should be built. 

The second set of logic is more accepted more broadly. If there is an externality, and the administration costs are small relative to the change in the externality, then the project should be pursued in order to increase total welfare.

I’m going to criticize and refine the second argument.  I was inspired by a student who wrote about education creating positive externalities for “all”. They kept using the word “all”. And I notated each time “not *all*”. While we might refer to something called ‘social’ cost and value, the existence of externalities does not imply that everyone is affected by the them identically. That’s a representative agent fallacy. The externalized costs and benefits are often irregularly distributed among 3rd parties. This is important because government intervention can impose its own externalities depending on how the administrative costs funded.

I’ll elaborate with two examples that illustrate when an irregular distribution of externalities is a problem and when it isn’t a problem.

Electric Plant Pollution

The first example illustrates how resolving an irregular distribution of externalities can be resolved without issue. Consider a coal-powered electric plant that serves a metropolitan area and creates pollution. That pollution drifts east and passively harms residents in the form of asthma exacerbation and long-term ill health. The residents to the west are unaffected by the pollution, thanks to favorable weather patterns. Obviously, one would rather live on the west side, all else constant (importantly, all else it not always constant and there is a case to be made that there is no externality here).

To resolve the externality, the government imposes a tax per particle on the power plant at a low administrative cost. That’s nice and efficient – we won’t waste our time with means-oriented regulations. In turn, the cost of electricity increases for all metropolitan residents, both those in the east and in the west. Why is this appropriate? Prior to the intervention, the electricity users in the west were enjoying electricity at a low price, failing to pay for the harm done by their consumption. For that matter, the residents to the east are also paying the higher rates, but now they enjoy better health.

In the end, the externality is resolved by imposing a cost on all consumers of the good – which happens to be everyone. This circumstance is not pareto efficient, but it is Kaldor-Hicks efficient. Everyone now considers the costs that they were previously able to impose on others and ignore.

That’s the best case scenario.

Continue reading

The Largest Health Systems in the US

Health spending keeps rising, and hospitals keep consolidating, so the largest health systems in the US keep growing bigger. But getting exact data on how big is surprisingly difficult. So I appreciate that someone else did the work, in this case Blake Madden of Hospitalogy. Here are his top 10:

See his post for the full list of the largest 113 health systems, and details and caveats on the methodology. I have found that Hospitalogy generally has good coverage of the business of health care, and that following Blake on Twitter is a good way to keep up with it.

How Much Inflation Do Americans Want?

If we have learned anything in the past 2 years, it’s that people don’t like inflation. Well, you probably already knew that. But I guess we learned that they really, really don’t like inflation. Polls of various sorts still indicate that Americans are upset about inflation, even though the worst of it was happening in June 2022, almost 2 full years ago.

But how much inflation do Americans want? The answer: almost 0%. In fact, the median preference is exactly 0% according to a new working paper titled simply “Inflation Preferences.” The mean preference was 0.2%.

But this paper does more than just survey people on their preferences. It also presents to them several “narratives” about inflation, and to see whether people who have considered those narratives have different preferences. Given my many blog posts about the relationship between wages and inflation (or rather, the race between them), this narrative was interesting to me:

T4 (Wage inflation) When prices increase over time (inflation), worker’s wages may not immediately adjust in proportion. Inflation, therefore, affects the amount of goods and services that workers can buy with their wages. By keeping inflation low, workers can buy a similar amount of goods and services over time.

People who had considered that narrative (wages increases trail price increases) tended to prefer even lower inflation rates, by about 0.7 percentage points. Again, perhaps this is obvious, but it is important to understand how different individuals think about inflation (it was the only one of five narratives that had a statistically significant negative impact on inflation preferences).

Finally, as one final interesting tidbit, survey respondents that were also Economics Majors in college reported higher inflation preferences, by about 1 percentage point.

My Frozen Assets at BlockFi, Part3: I Finally Recovered 27% of My Original Funds.

Well, it’s finally over. As noted in previous blog posts, back when interest rates were essentially zero, I started an account with cryptocurrency investing firm BlockFi. They paid me a hefty 9% per year for lending out my crypto coin to “trusted institutional counterparties”, backed by large collateral. However, when  Sam Bankman-Fried’s FTX exchange went belly up, it took BlockFi with it. (Bankman-Fried, the former rock-star white knight of the crypto world, is now in prison for fraud).  My funds at BlockFi disappeared into the black hole of bankruptcy proceedings for about a year and a half.

Last month, a judge finally allowed a settlement for clients to withdraw their assets from their interest-bearing accounts. There were two wrinkles. First, you get far less than 100% of your funds. Most of my money got chewed up in the corporate bankruptcy itself, and then was eaten by the law firm (Kroll) processing the bankruptcy and the client reimbursement process. So,  I’m only getting about 27% percent of my money back.

As an aside, Kroll got hacked about a year ago, leaking the names and email addresses of us BlockFi clients, and so some scammer sent out a very well-crafted email that a number of people, including me (briefly) were taken in by, as I wrote earlier.  if you responded to that scam email, you ended up connecting your wallet to a scam application, which could then suck everything out of your wallet. Fortunately, I had almost nothing in my wallet for the short time I had it connected, but other victims lost considerable sums. I guess the reason why criminals continue to run crypto scams is because they are profitable, like the legendary bank robber Willie Sutton who robbed banks because “that’s where the money is.”

The other wrinkle In the BlockFi reimbursement is that they will only reimburse you with the actual cryptocurrency coin that you held, not with its dollar value. So, I had to set up a cryptocurrency wallet (I used Trust wallet) to receive my crypto, which was all in the form of the stablecoin USDC.

I had to do considerable background work to make this happen. In order to test that that wallet worked to receive USDC, I had to also set up a cryptocurrency exchange account, which I did with Coinbase (which seemed to be the most solid crypto exchange). I had to connect that account with my bank, put some money into the Coinbase exchange, buy some USDC, and send it to my crypto wallet to make sure that it all worked.


As of a week ago, after some fairly intrusive ID verification, the reimbursement machinery did finally deposit the measly remnants of my USDC into my wallet. OK, I thought, I’ll just transfer that to my Coinbase exchange account, turn the USDC into cash and be done with it all.


But not so fast… Because USDC is transferred over the Ethereum network, I had to have enough ETH coin in my Trust wallet to pay for the transfer. The network transfer cost, called the gas fee, was about eight dollars at midday, going down to about three dollars by 10 o’clock at night.

So, I had to go into my Coinbase account, convert some USDC there into ETH (incurring a $1.49 fee for that), and then send some ETH to my Wallet, incurring yet another a transfer fee there. Then I could use that ETH in my wallet to pay for the transfer of the USDC to my Coinbase exchange. Then at long last I was able to convert my USDC to cash and transfer it to my bank account, to finally put this whole BlockFi drama to rest.

Looking on the bright side of all this uproar, I now have a functioning cryptocurrency exchange account and wallet, and am familiar with elementary crypto operations. This might prove handy if I ever want to dabble more in this area or if some other need arises. For now, however, I have had enough of crypto.

The effect of the minimum wage on everything

David Neumark has an excellent article reviewing the extensive literature examining the effects of the minimum wage on, well, a little bit of everything. Sometimes we see improved outcomes, sometimes worse outcomes, often not much of anything. I’m not demeaning this literature to which I’ve myself helped make a modest contribution, but there does arise the concern that perhaps the fruit has begun to hang a bit too low. Which is to say that in a world of modern computing, where regressions can be run at approaching zero cost and policy changes are characterized by an at least a minimally sufficient level of exogeneity, there’s nothing stopping anyone from regressing any measurable outcome on the minimum wage. We’re still arguing about the minimum wage, but what exactly is it that we are learning?

I’m going to head this post off at the pass befores it veers into “back in my day economics used to be about the theory” territory. Yes, the ascendance of empirically-driven applied economics has led to theory to taking something of a backseat, at least in terms of the sheer volume of published research, but I don’t think that is what is going on with the minimum wage literature. Rather, I think its a story of supply and demand.

The minimum wage is an almost perfect issue for people to argue over. It’s not life or death, which keeps the temperature below “brick throwing” levels. The status quo always bears the possibility of change, making arguments policy salient. The absence of action is a meaningful option, particularly in a world with non-trivial inflation. It’s a quantifiable policy that affects incomes and employment directly, which means it’s sufficiently concrete for anyone to have an opinion on. Last, but certainly not least, it lends itself to binary opinion-affiliation in that you either think the minimum wage should be higher or you don’t.

From the point of view of researchers, this adds up to a policy for which there will be near endless research demand. To satisfy that demand your research should, preferably, give consumers a new reason to belief the minimum wage should or should not be higher. To do that a researcher need either i) give new and useful evidence as to how and how much the minimum wage affects earnings and employment, or ii) new and useful evidence that the minimum wage makes some other measurable outcome better or worse. When you consider that the cost of consuming new research is both low and constant, it’s fair to consider the demand to be perfectly elastic. Coupled with the increase in the supply of empirical research generated by reduced cost of computing noted earlier, we shouldn’t be surprised by an equilibrium where an ever-growing number of outcomes have been regressed on the minimum wage.

I don’t think this is anything to get worked up over, don’t see any first-order negative externalities. Most complaints about low-cost empirical research usually sound like academics pining for a time with higher barriers to entry, when you had to be “really good” to produce economic research. The assumption that the complainer is themselves, of course, “really good” always seems to remain unstated. Back to my earlier question, though: what are we learning?

If you’re genuinely curious about the minmum wage, read Neumark’s review. It’s characteristically excellent. Rather than recap, let me come out and say what I think I’ve learned from the reading a lot, but certainly not all, of the minimum wage literature. The minimum wage matters, it’s salient to people earnings, but not nearly as much as the volume of research or argument would suggest. The effects observed tend to be moderate, but labor markets are sufficiently local, heterogenous, and complex that the there remains the possibility of observing different results with different (but largely honest) analyses. This goes doubly so for observing any second-order effects beyond wages and employment, such as health, education, or crime. You are more likely to observed improved outcomes when changes are small, deleterious effects when changes are large.

Those are easy, largely riskless conclusions to share, so let me go a bit farther. The fact that we observe anything but trivial outcomes, positive or negative, is a stark reminder of the margins on which so many people are making decisions. Whether it’s earning a dollar more an hour or losing half a shift a week, it is telling that we see more criminal recidivism, more smoking, less teen-pregnancy, more maternal time with children, and a dozen other effects. It just doesn’t take that much to move the needle.

There is a constant cultural bombardment to value income and material goods less. Perhaps the lesson of a thousand and one minimum wage regressions is that many people aren’t experiencing the diminishing returns to income that popular advice would have you believe. For the young, less-educated, recently immigrated, or those burdened with the stigma of a criminal record, the income elasticity of human behavior remains very much intact. Labor policies matter, even if the minimum wage shouldn’t be quite so close to the top of the list.

Zuckerberg wants to solve general intelligence

Why does Mark Zuckerberg want to solve general intelligence? Well, for one thing, if he doesn’t, one of his competitors will have a better chatbot. Zuckerberg wants to be the best (and good for him). At his core, he wants to build the best stuff (even the world’s best cattle on his ranch).

If AGI is possible, it will get built. I’m not the first person to point out that this is a new space race. If America takes a pause, then someone else will get there first. However, I thought the Zuck interview was an interesting microcosm for why AGI, if possible, will get made.

… We started FAIR about 10 years ago. The idea was that, along the way to general intelligence or whatever you wanna call it, there are going to be all these different innovations and that’s going to just improve everything that we do. So we didn’t conceive of it as a product. It was more of a research group. Over the last 10 years it has created a lot of different things that have improved all of our products. …
There’s obviously a big change in the last few years with ChatGPT and the diffusion models around image creation coming out. This is some pretty wild stuff that is pretty clearly going to affect how people interact with every app that’s out there. At that point we started a second group, the gen AI group, with the goal of bringing that stuff into our products and building leading foundation models that would power all these different products.
… There’s also basic assistant functionality, whether it’s for our apps or the smart glasses or VR. So it wasn’t completely clear at first that you were going to need full AGI to be able to support those use cases. But in all these subtle ways, through working on them, I think it’s actually become clear that you do. …
Reasoning is another example. Maybe you want to chat with a creator or you’re a business and you’re trying to interact with a customer. That interaction is not just like “okay, the person sends you a message and you just reply.” It’s a multi-step interaction where you’re trying to think through “how do I accomplish the person’s goals?” A lot of times when a customer comes, they don’t necessarily know exactly what they’re looking for or how to ask their questions. So it’s not really the job of the AI to just respond to the question.
You need to kind of think about it more holistically. It really becomes a reasoning problem. So if someone else solves reasoning, or makes good advances on reasoning, and we’re sitting here with a basic chat bot, then our product is lame compared to what other people are building. At the end of the day, we basically realized we’ve got to solve general intelligence… (emphasis mine)

Credit to Dwarkesh Patel for this excellent interview. Credit to M.Z. for sharing his thoughts on topics that affect the world.

“we’ve got to solve general intelligence” If a competitor solves AGI first, then you are left behind. No one would not want general intelligence on their team, on the assumption that it can be controlled.

I would like the AGI to do my chores for me, please. Unfortunately, it’s more likely to be able to write my blog posts first.

Fossil Fuel Frenzy: The Driving Force Behind US Extractive Growth

What with all the talk about semi-conductor production and rare-earth mineral extraction, I think that it’s worth examining what the USA produces in terms of what we get out of the ground. This includes mining, quarrying, oil and natural gas extraction, and some support activities (I’ll jump more into the weeds in the future). I’ll broadly call them the ‘extractive’ sectors. How important are these industries? In 2021 extractive production was worth $520 billion. That was roughly 2% of all GDP. Below is the break down by type of extraction.

Examining the graph of total extraction output below tells a story. The US increased production of extracted material substantially between the Great Depression and 1970.  That’s near the time that the clean water and clean air acts were passed. But the change in the output growth rate is so stark, that I suspect that those were not the only causes of change (reasonable people can differ). For the next 40 years, there was a malaise in output. This was the period during which it was popular to talk about our natural resource insecurity. As in, if we were to be engaged in a large war, then would we be able to access the necessary materials for wartime production?  

https://fred.stlouisfed.org/graph/?g=1kWNU

But for the past 15 years we’ve experienced a boom with extracted output rising by 50%, an average growth rate of 2.7% per year. That’s practically break-neck speeds for an old industry at a time when the phrase ‘great stagnation’ was being thrown about more generally. By 2023, we were near all-time-high output levels (pre-pandemic was higher by a smidge).

For people concerned about resource security, the recent boom is good news. For people who associate digging with environmental degradation, greater extraction is viewed with less enthusiasm. Those emotions are especially high when it comes to fossil fuel production. Below is a graph that identifies the three major components of extraction indexed to the 2021 constant prices. By indexing to the relative outputs of a particular year, the below graph is a close-ish proxy to real output that is comparable in levels.

Continue reading

How Do Certificate of Need Laws Affect Health Care Workers?

The short answer is that they don’t affect wages or overall employment levels, at least according to a new article in the Southern Economic Journal (ungated version here) by Kihwan Bae and me.

This was surprising to me, as I kind of expected CON laws to harm workers. Certificate of Need laws require many types of health care providers to obtain the permission of a state board before they are allowed to open or expand. This could lead to fewer health care facilities, and so less demand for health care workers, lowering wages and employment. It could also lead to less competition among health care employers, to similar effect.

On the other hand, less competition in the market for health services could raise profits, with room to share them in the form of higher wages. Or, CON being primarily targeted at capital expenditures like facilities and equipment could increase the demand for labor (to the extent that labor and capital are substitutes in health care). All these competing theories seem to cancel out to one big null when we look at the data.

We use 1979-2019 data from the Current Population Survey and a generalized triple-difference approach comparing CON-repealing to CON-maintaining states, and find a bunch of fairly precise zeroes. This holds for many different definitions of “health care worker”: those who work in the health industry, in health occupations, in hospitals, in health care outside hospitals, nurses, physicians, and more.

This is the first word on the topic, not the last; I wouldn’t be too surprised if someone down the road finds that CON does significantly affect health care workers. In this paper we pushed hard on the definition of “health care workers”, but not on “Certificate of Need” or “wages”. We simply classify states as “CON” or “non-CON” because that is what we have data for, but some states have much stricter programs than others, and some day someone will compile the data on this back to the 1970’s. The easier thread to pull on is “wages”. We use one good measure (the natural log of inflation-adjusted hourly real wages), but don’t do any robustness checks around it; considering “business income” could be especially important here. It is also possible that CON affects workers in other ways; we only checked wages and employment.

The full paper is here (ungated here) if you want to read more.

Counting Jobs (Revisited)

In January 2023 I had a post looking at the different ways that the Bureau of Labor Statistics measures employment. Those who follow the data closely probably know about the difference between the household and establishment surveys, which the monthly jobs report data is based on. But these are just surveys.

The more comprehensive data (close to the universe of workers, roughly 95%) is the Quarterly Census of Employment and Wages. While more comprehensive, this data comes out with a much longer lag, and is only released once per quarter. The QCEW is just the raw count of workers, which is useful in some ways, but we also know that there are normal seasonal fluctuations, which the QCEW doesn’t adjust for. Therefore, year-over-year changes in jobs are the best way to look at trends in this data. In September 2023 (latest month available), the US had 2.25 million more workers than in the previous September. For comparison, the establishment survey showed an increase of 3.13 million jobs that month, and the household survey showed a change of 2.66 million — suggesting they both might be overstating job growth.

Still with me? Here’s one more set of jobs data: the Business Employment Dynamics data. This dataset is built on the QCEW data, but allows more fine detailed insights into what types and sizes of firms are gaining or losing jobs. Like the QCEW, the most recent data is for the 3rd quarter of 2023 (just released today), but when looking at the aggregate data, it has one advantage over the QCEW: it is seasonally adjusted, so we can look at the most recent quarterly change (not really useful for not-seasonally-adjusted data). The BED data also looks only at private sector jobs, so it is looking at the health of the private labor market (and ignoring changes in government employment).

The latest BED data do show a possibly worrying trend: the 3rd quarter of 2023 showed a net loss of 192,000 private-sector jobs. That’s the first loss since the height of the pandemic, and ignoring the first half of 2020, the only quarterly decline since 2017. Here’s the chart (note: y-axis is truncated because the 2020q2 job loss is so large it makes the chart unreadable):

I should note that this data is subject to revisions, even though the QCEW is mostly complete. The second quarter of 2022 originally showed a decline, but that was later revised upwards as QCEW is updated and seasonal adjustment factors are updated. Still as, this data stands, it is a worrying jobs number that differs from the monthly surveys. For the change from 2023q2 to 2023q3, the establishment survey shows a gain of 640,000 jobs and the household survey also shows a gain of 546,000. Like the QCEW raw data, the BED seasonally adjusted data suggests that the monthly surveys may be overstating job growth.